Summer Raspberry Pi NSM Update (Slipping into NATS JetStream)
Earlier this year, I blogged about a Raspberry Pi NSM setup that used Suricata and Benthos to stream IDS events to Kafka or SQS. Although I…

Earlier this year, I blogged about a Raspberry Pi NSM setup that used Suricata and Benthos to stream IDS events to Kafka or SQS. Although I haven’t made as much progress this project as I wanted to, I have continued to tinker with it. As part of a book I’m working on, I’ve had to learn about NATS and I wanted to find a way to work it into using Suricata to monitor my home network.
Synadia continues to invest in NATS and version 2.3.0 was just released this week. The server and tooling are under active development in 2020 and 2021. If you haven’t heard of NATS, check it out!
What I’ve been playing with over the last few weeks is using Suricata as an event source to test out NATS JetStream and understand streams, consumers, and message delivery using the NATS CLI. In this blog, I’ll introduce both of these and provide examples. I won’t provide too much background or attempt to replicate the documentation or the references that I’ve put at the end.
With NATS Streaming being deprecated in 2023, there are two basic NATS modes you should consider for new use cases: NATS PubSub and NATS JetStream. The documentation still includes NATS Streaming and there is a separate Jetstream that can be confusing if you are new to NATS. Don’t worry, you don’t need to know what STAN is anymore!
This blog just scratches the surface of what I’ve been learning and I’ve only used a fraction of the capabilities of NATS for this trivial use case, but you will see how build the display at the top of the article by tapping into multiple subjects simultaneously courtesy of PubSub!
NSM4Home Revisited
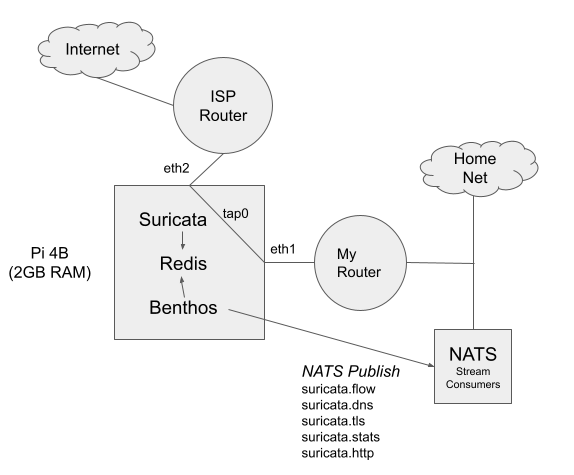
The goal of nsm4home is to build an easily deployable NSM implementation that works on both 32/64-bit ARM (Raspian or Ubuntu 20.04) and 64-bit Intel Linux. It takes advantage of pre-built Suricata Docker images that include support for logging to Redis. A Pi4B with 2GB RAM easily supports 100MBps links and I currently monitor the uplink from my Ubiquiti Dream Machine with bridged Gigabit USB-3 NICs. The Pi4 runs at 25–35% CPU depending on the traffic.
In my initial POC, I sent messages to SQS or a local Kafka cluster with each Suricata event_type written to a different Kafka topic. I’ve done something similiar with RabbitMQ. These worked just fine, but the lack of Confluent ARM Docker images made it challenging to run the cluster on non-Intel hardware. If I’m honest, Kafka was a bit heavyweight for what I needed. It was also a bit sluggish on my aging home hardware. Restarting Kafka and Zookeeper on older Intel Core hardware took up to 30 seconds.
Running NATS Server 2.2 starts (or restarts) in under 100ms and it is just a single binary with a far less complex configuration. You can of course run on Docker or K8s, but not needed since it is a simple, single binary with minimal command-line options. Not having to deal with the overhead of a JVM or Erlang (in the case of RabbitMQ) is a bonus and NATS prides itself on simplicity and operability which I’ve found to be the case in my testing. At base load, CPU utilization is less than 2% and when cleaning the backlog CPU didn’t exceed 20%. This is a major difference from Kafka, so you can see why NATS is useful for Edge analytics on lower-powered devices. Lastly, the NATS CLI has come a long way and allows you to replace the previous go clients for learning how to deploy and configure NATS Server.
NATS Basics
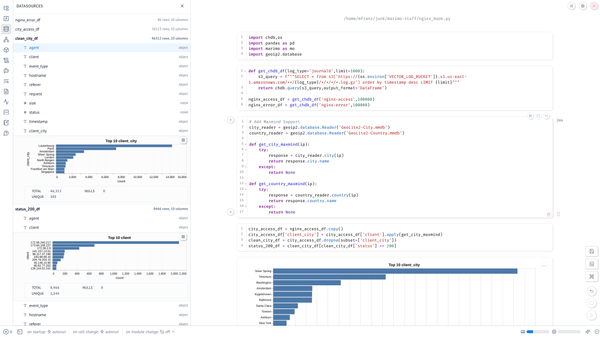
I’ll start with an example on how to pull events from Redis to NATS. Just use the following configuration file with Benthos:
This is similar to what I did previously by creating a different Kafka topic for each of the different Suricata event types: DNS Queries, TLS Message, NetFlow, etc. My configuration doesn’t use any of the real IDS alerts and only does protocol decoding.
$ redis-cli monitor
OK
1624222530.368591 [0 127.0.0.1:58452] "LPUSH" "suricata" "{\"timestamp\":\"2021-06-20T20:55:30.368198+0000\",\"flow_id\":1877663763972905,\"in_iface\":\"tap0\",\"event_type\":\"flow\",\"src_ip\":\"192.168.1.239\",\"src_port\":37168,\"dest_ip\":\"1.1.1.1\",\"dest_port\":53,\"proto\":\"UDP\",\"app_proto\":\"dns\",\"flow\":{\"pkts_toserver\":2,\"pkts_toclient\":1,\"bytes_toserver\":324,\"bytes_toclient\":207,\"start\":\"2021-06-20T20:48:40.508713+0000\",\"end\":\"2021-06-20T20:48:40.525191+0000\",\"age\":0,\"state\":\"established\",\"reason\":\"unknown\",\"alerted\":false},\"host\":\"pi4b-4774db6f\"}"
1624222530.369296 [0 127.0.0.1:58452] "LPUSH" "suricata" "{\"timestamp\":\"2021-06-20T20:55:30.369081+0000\",\"flow_id\":189067306747230,\"in_iface\":\"tap0\",\"event_type\":\"flow\",\"src_ip\":\"192.168.1.239\",\"src_port\":40147,\"dest_ip\":\"172.217.164.138\",\"dest_port\":443,\"proto\":\"UDP\",\"app_proto\":\"failed\",\"flow\":{\"pkts_toserver\":435,\"pkts_toclient\":464,\"bytes_toserver\":93943,\"bytes_toclient\":106398,\"start\":\"2021-06-20T20:48:40.017758+0000\",\"end\":\"2021-06-20T20:49:39.411173+0000\",\"age\":59,\"state\":\"established\",\"reason\":\"unknown\",\"alerted\":false},\"host\":\"pi4b-4774db6f\"}"
1624222530.370299 [0 127.0.0.1:58452] "LPUSH" "suricata" "{\"timestamp\":\"2021-06-20T20:55:30.369748+0000\",\"flow_id\":611305537805520,\"in_iface\":\"tap0\",\"event_type\":\"flow\",\"src_ip\":\"192.168.1.239\",\"src_port\":32437,\"dest_ip\":\"1.1.1.1\",\"dest_port\":53,\"proto\":\"UDP\",\"app_proto\":\"dns\",\"flow\":{\"pkts_toserver\":1,\"pkts_toclient\":1,\"bytes_toserver\":85,\"bytes_toclient\":130,\"start\":\"2021-06-20T20:47:42.859344+0000\",\"end\":\"2021-06-20T20:47:42.874272+0000\",\"age\":0,\"state\":\"established\",\"reason\":\"unknown\",\"alerted\":false},\"host\":\"pi4b-4774db6f\"}"
Next, run Benthos with TRACE logging enabled. Basically, because you are caching the events in Redis you can muck around with your NATS Server configuration or your Benthos pipeline without losing events.
$ benthos --log.level TRACE -c redisnats.yml
{"@timestamp":"2021-06-20T20:52:52Z","@service":"benthos","component":"benthos","level":"INFO","message":"Launching a benthos instance, use CTRL+C to close."}
{"@timestamp":"2021-06-20T20:52:52Z","@service":"benthos","component":"benthos","level":"INFO","message":"Listening for HTTP requests at: http://0.0.0.0:4195"}
{"@timestamp":"2021-06-20T20:52:52Z","@service":"benthos","component":"benthos.input","level":"INFO","message":"Receiving messages from Redis list: suricata"}
{"@timestamp":"2021-06-20T20:52:52Z","@service":"benthos","component":"benthos.input","level":"TRACE","message":"Consumed 1 messages from 'redis_list'."}
{"@timestamp":"2021-06-20T20:52:52Z","@service":"benthos","component":"benthos.output","level":"INFO","message":"Sending NATS messages to subject: suricata.${! json(\"event_type\") }"}
{"@timestamp":"2021-06-20T20:52:52Z","@service":"benthos","component":"benthos.output","level":"TRACE","message":"Attempting to write 1 messages to 'nats'."}
{"@timestamp":"2021-06-20T20:52:52Z","@service":"benthos","component":"benthos.output","level":"DEBUG","message":"Writing NATS message to topic suricata.flow"}
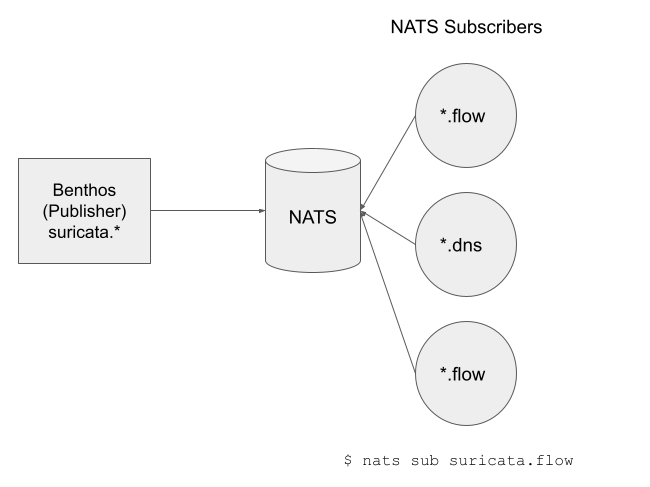
Either the standard NATS or the new NATS Jetstream output in Benthos will work. Given how simple it is to send events to a NATS server, let’s talk about what you get out of the box with NATS PubSub.
NATS PubSub uses at most once delivery with one to many communication from publishers to subscribers. So if a subscriber is not active it will not receive the message. You’ll miss it. This is inherent in the protocol and you need to be mindful of this in your use cases.
What this also means is that all subscribers to a subject (or set of subjects) will receive the published messages.
(NOTE: You’ll need to install the NATS CLI for all the examples below. If you are paying attention you’ll see I’m mixing up examples from a Suricata collector on a PI4 and one I use on a Linux laptop.)
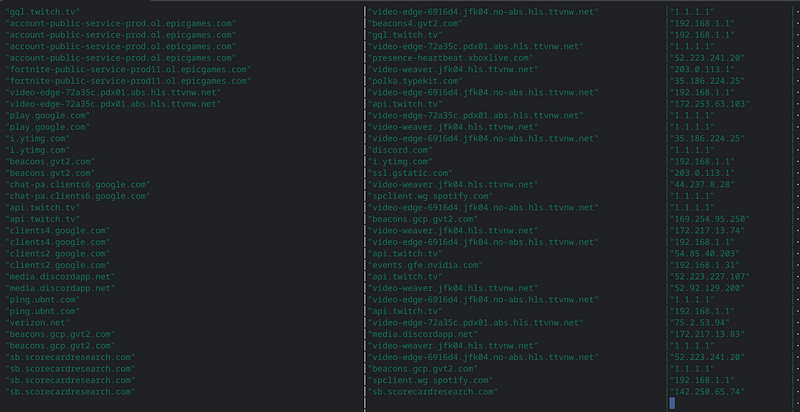
$ nats -s nats://192.168.2.31 sub suricata.dns -r | jq -c 'select(.dns.type=="query")| .dns.rrname'
"www.gstatic.com"
"connectivity-check.ubuntu.com"
"28.client-channel.google.com"
"static.xx.fbcdn.net"
"f-log-extension.grammarly.io"
Multiple subscribers can tap into the real time stream. We could have the same subject and from a different host and seen the same activity, but this shows how easy it is to monitor NetFlow events from Suricata:
$ nats -s nats://192.168.2.31 sub suricata.dns -r | jq -c 'select(.dns.type=="query")| .dns.rrname'
"www.gstatic.com"
"connectivity-check.ubuntu.com"
"28.client-channel.google.com"
"static.xx.fbcdn.net"
"f-log-extension.grammarly.io"
Or listing decoded SNIs from TLS traffic:
$ nats -s nats://192.168.2.31 sub -r suricata.tls | jq -c .tls.sni
"clients4.google.com"
"r4---sn-8xgp1vo-p5qs.googlevideo.com"
"r4---sn-8xgp1vo-p5qs.googlevideo.com"
"r4---sn-p5qs7ned.googlevideo.com"
"r4---sn-5hne6nsr.googlevideo.com"
"www.googleapis.com"
"mtalk.google.com"
We obviously could have run a NATS Server on the same host as Suricata and Redis but the assumption is the Redis is just a local cache of events that will be sent to a centralized data store on real SSD/SATA disks (vs. Micro SD cards on the Pi) but also allows us to do maintenance on the NATS cluster. Benthos does have decent error handling when sinks disappear but usually, I stop the stream and let the events flow to Redis. Using Kafkacat (or with a Python consumer) I could sequentially retrieve messages from a topic but there was no way to easily watch the events in real time that would not pull events off the queue and I really don’t think there would be a way to build the view at the top the dashboard in Kafka. And certainly without coding.
Adding Storage Persistence with Streams
By default, NATS PubSub lacks the persistence that many of us expect if we’ve used Kafka, RabbitMQ, or SQS. There is no queue for workers to pull from. Messages are “multicast” to subscribers, for those of you that have a networking background. That all changes with JetStream. JetStream adds exactly once delivery within a time window.
Below I created a disk-based stream (most of the examples use uppercase which I found annoying) for all subjects that match suricata.*.
$ nats str info suricata
Information for Stream suricata created 2021-06-24T22:10:02-04:00Configuration:Subjects: suricata.*
     Acknowledgements: true
            Retention: File - Limits
             Replicas: 1
       Discard Policy: Old
     Duplicate Window: 2m0s
     Maximum Messages: unlimited
        Maximum Bytes: unlimited
          Maximum Age: 0.00s
 Maximum Message Size: unlimited
    Maximum Consumers: unlimitedState:
             Messages: 20,051
                Bytes: 15 MiB
             FirstSeq: 1 @ 2021-06-25T02:13:52 UTC
              LastSeq: 20,051 @ 2021-06-25T11:17:10 UTC
     Active Consumers: 0
You see’ll this stream has around 20K messages in less than 12 hours based on all the events sent from Benthos. I have not yet tried to fill up a disk yet, but based on this configuration it should age out older messages when the disk fills up.
But back to what is a Stream. Think of it as a sequential container for persisting messages that the NATS server receives from subscribers.
That being said, you can read single messages with the CLI:
$ nats str get suricata 2000
Item: suricata#2000 received 2021-06-25 02:22:57.432037477 +0000 UTC on Subject suricata.dns{"timestamp":"2021-06-25T02:22:57.429893+0000","flow_id":1234393968485098,"in_iface":"wlp1s0","event_type":"dns","src_ip":"192.168.3.235","src_port":54238,"dest_ip":"192.168.3.1","dest_port":53,"proto":"UDP","dns":{"version":2,"type":"answer","id":52948,"flags":"8180","qr":true,"rd":true,"ra":true,"rrname":"cdn.boomtrain.com","rrtype":"A","rcode":"NOERROR","answers":[{"rrname":"cdn.boomtrain.com","rrtype":"CNAME","ttl":268,"rdata":"dt9s2nur7u2e9.cloudfront.net"},{"rrname":"dt9s2nur7u2e9.cloudfront.net","rrtype":"A","ttl":28,"rdata":"13.225.229.55"},{"rrname":"dt9s2nur7u2e9.cloudfront.net","rrtype":"A","ttl":28,"rdata":"13.225.229.18"},{"rrname":"dt9s2nur7u2e9.cloudfront.net","rrtype":"A","ttl":28,"rdata":"13.225.229.7"},{"rrname":"dt9s2nur7u2e9.cloudfront.net","rrtype":"A","ttl":28,"rdata":"13.225.229.123"}],"grouped":{"CNAME":["dt9s2nur7u2e9.cloudfront.net"],"A":["13.225.229.55","13.225.229.18","13.225.229.7","13.225.229.123"]}},"host":"dell-inspiron-15"}
This would retrieve the 2000th message in the stream. Or read all messages from the beginning.
$ nats str view suricata
[1] Subject: suricata.flow Received: 2021-06-24T22:13:52-04:00
{"timestamp":"2021-06-25T02:13:52.425594+0000","flow_id":254144947417594,"in_iface":"wlp1s0","event_type":"flow","src_ip":"192.168.3.235","src_port":46980,"dest_ip":"52.35.253.100","dest_port":
443,"proto":"TCP","app_proto":"tls","flow":{"pkts_toserver":24,"pkts_toclient":22,"bytes_toserver":3574,"bytes_toclient":15442,"start":"2021-06-25T02:11:27.455162+0000","end":"2021-06-25T02:12:
27.914111+0000","age":60,"state":"closed","reason":"unknown","alerted":false},"tcp":{"tcp_flags":"1b","tcp_flags_ts":"1b","tcp_flags_tc":"1b","syn":true,"fin":true,"psh":true,"ack":true,"state"
:"closed"},"host":"dell-inspiron-15"}
[2] Subject: suricata.flow Received: 2021-06-24T22:13:52-04:00
{"timestamp":"2021-06-25T02:13:50.424423+0000","flow_id":675322327545688,"in_iface":"wlp1s0","event_type":"flow","src_ip":"192.168.3.235","src_port":47672,"dest_ip":"69.166.1.15","dest_port":44
3,"proto":"TCP","app_proto":"tls","flow":{"pkts_toserver":20,"pkts_toclient":15,"bytes_toserver":7058,"bytes_toclient":7974,"start":"2021-06-25T02:12:01.472920+0000","end":"2021-06-25T02:12:48.
687435+0000","age":47,"state":"closed","reason":"unknown","alerted":false},"tcp":{"tcp_flags":"1f","tcp_flags_ts":"1a","tcp_flags_tc":"1f","syn":true,"fin":true,"rst":true,"psh":true,"ack":true
,"state":"closed"},"host":"dell-inspiron-15"}
(Obviously, you could do the same with NATS client libraries that support JetStream although I have only done this in Go.)
Adding a Pull Consumer
At first, this use of the term consumer was very confusing to me, because it is different than how Kafka uses it. In NATS, the consumer is not a client. The consumer is defined on the server, within a stream. A consumer is a processing abstraction within the stream to allow processing of messages through either a push or a pull. As mentioned above, streams define the storage of messages, but consumers are actually required to process messages. They provide the mechanism for routing messages based on topics that feels similar to how RabbitMQ binds exchanges to queues.
(Yes, I know the examples above show consumption of messages with the CLI without creating consumers, which is what we will do next).
Although clients can obviously manage create consumers and streams in the same manner as Kafka but I didn’t do that for my examples in this blog.
Below, I created the consumer “flow” for handling NetFlow events. This can be done with command-line arguments or with the NATS client libraries but this is simple enough.
$ nats con add
? Consumer name flow
? Delivery target (empty for Pull Consumers)
? Start policy (all, new, last, 1h, msg sequence) all
? Replay policy instant
? Filter Stream by subject (blank for all) suricata.flow
? Maximum Allowed Deliveries -1
? Maximum Acknowledgements Pending 0
? Select a Stream suricata
Information for Consumer suricata > flow created 2021-06-21T01:07:37ZConfiguration:Durable Name: flow
           Pull Mode: true
      Filter Subject: suricata.flow
         Deliver All: true
          Ack Policy: Explicit
            Ack Wait: 30s
       Replay Policy: Instant
     Max Ack Pending: 20,000State:Last Delivered Message: Consumer sequence: 0 Stream sequence: 0
     Acknowledgment floor: Consumer sequence: 0 Stream sequence: 0
         Outstanding Acks: 0 out of maximum 20000
     Redelivered Messages: 0
     Unprocessed Messages: 97882
(CAVEAT: You cannot create consumers with a list of subjects, but you can create streams with multiple subjects. Thanks to @ripienaar for catching this)
The consumer “flow” allows use to process NetFlow messages. You will see that it immediately was populated with 97K messages that were in the stream that had the subject of “suricata.flow.” The start policy determines which messages you want to be consumable when the consumer is created. We chose ALL above, which why the unprocessed messages showed 97882 immediately.
(NOTE: The durable name and the subject are both required if you use the JetStream APIs (see https://pkg.go.dev/github.com/nats-io/nats.go#JetStream.PullSubscribe) to programmatically consumer messages instead of the CLI. This took a bunch of trial and error and was not immediately obvious. That seems weird that you would need both.)
Now let’s consume a message from this pull-based consumer “flow.” I’ve enabled protocol tracing so you can see the client in the nats-cli retrieves information about about the consumer then pulls the next message:
$ nats con sub suricata flow --trace10:43:58 >>> $JS.API.CONSUMER.INFO.suricata.flow
10:43:58 <<< $JS.API.CONSUMER.INFO.suricata.flow
{"type":"io.nats.jetstream.api.v1.consumer_info_response","stream_name":"suricata","name":"flow","created":"2021-06-26T14:36:02.02921684Z","config":{"durable_name":"flow","deliver_policy":"all","ack_policy":"explicit","ack_wait":30000000000,"max_deliver":-1,"filter_subject":"suricata.flow","replay_policy":"instant","max_waiting":512,"max_ack_pending":20000},"delivered":{"consumer_seq":21,"stream_seq":52},"ack_floor":{"consumer_seq":21,"stream_seq":52},"num_ack_pending":0,"num_redelivered":0,"num_waiting":0,"num_pending":25704,"cluster":{"leader":"NCPZIFZSNRP2OJSPEP7AEPV2X2AGBMJYY5U6ZZ3NHJGFOC6LW7JHBKVE"}}10:43:58 >>> $JS.API.CONSUMER.INFO.suricata.flow
10:43:58 <<< $JS.API.CONSUMER.INFO.suricata.flow
{"type":"io.nats.jetstream.api.v1.consumer_info_response","stream_name":"suricata","name":"flow","created":"2021-06-26T14:36:02.02921684Z","config":{"durable_name":"flow","deliver_policy":"all","ack_policy":"explicit","ack_wait":30000000000,"max_deliver":-1,"filter_subject":"suricata.flow","replay_policy":"instant","max_waiting":512,"max_ack_pending":20000},"delivered":{"consumer_seq":21,"stream_seq":52},"ack_floor":{"consumer_seq":21,"stream_seq":52},"num_ack_pending":0,"num_redelivered":0,"num_waiting":0,"num_pending":25704,"cluster":{"leader":"NCPZIFZSNRP2OJSPEP7AEPV2X2AGBMJYY5U6ZZ3NHJGFOC6LW7JHBKVE"}}10:43:58 >>> $JS.API.CONSUMER.MSG.NEXT.suricata.flow:
{"expires":5000000000,"batch":1}[10:43:58] subj: suricata.flow / tries: 1 / cons seq: 22 / str seq: 59 / pending: 25703
{"timestamp":"2021-06-26T01:45:49.241656+0000","flow_id":1322912283194119,"in_iface":"wlp1s0","event_type":"flow","src_ip":"192.168.3.235","src_port":50090,"dest_ip":"172.217.11.35","dest_port":443,"proto":"UDP","app_proto":"failed","flow":{"pkts_toserver":9,"pkts_toclient":7,"bytes_toserver":3865,"bytes_toclient":3640,"start":"2021-06-26T01:36:53.946951+0000","end":"2021-06-26T01:36:54.091173+0000","age":1,"state":"established","reason":"unknown","alerted":false},"host":"dell-inspiron-15"}
You will notice that the next message will be retrieved if you process from a different client. It does not start at the beginning, which is what we’d expect.
$ nats -s nats://192.168.3.235:4222 con sub suricata flow
[10:52:34] subj: suricata.flow / tries: 1 / cons seq: 23 / str seq: 60 / pending: 25960{"timestamp":"2021-06-26T01:45:48.574631+0000","flow_id":55403019267034,"in_iface":"wlp1s0","event_type":"flow","src_ip":"192.168.3.235","src_port":49846,"dest_ip":"192.168.3.1","dest_port":53,"proto":"UDP","app_proto":"dns","flow":{"pkts_toserver":1,"pkts_toclient":1,"bytes_toserver":82,"bytes_toclient":82,"start":"2021-06-26T01:39:20.027610+0000","end":"2021-06-26T01:39:20.032483+0000","age":0,"state":"established","reason":"unknown","alerted":false},"host":"dell-inspiron-15"}
The NATS CLI allows to list current consumes that are associated with a stream.
$ nats con ls suricata
Consumers for Stream suricata:flow
stats
I had created a PUSH consumer for Suricata stats as an example but I’ll skip describing the difference between the two in this blog — or git into message delivery and acknowledgement.$ nats con info suricata stats
Information for Consumer suricata > stats created 2021-06-26T11:06:08-04:00Configuration:Durable Name: stats
    Delivery Subject: stats.suricata
      Filter Subject: suricata.stats
        Deliver Next: true
          Ack Policy: None
       Replay Policy: Instant
        Flow Control: falseState:Last Delivered Message: Consumer sequence: 12 Stream sequence: 72219
     Acknowledgment floor: Consumer sequence: 12 Stream sequence: 72213
         Outstanding Acks: 0
     Redelivered Messages: 0
     Unprocessed Messages: 393
One thing I will cover is that this does push messages that meet the subject criteria to a new subject.
You’ll notice I use stats.suricata which does not match any of the wildcards.
$ nats sub stats.suricata
20:05:05 Subscribing on stats.suricata
[#1] Received JetStream message: consumer: suricata > stats / subject: suricata.stats / delivered: 1 / consumer seq: 1078 / stream seq: 115337 / ack: false
{"timestamp": "2021-06-27T00:05:25.568566+0000", "event_type": "stats", "stats": {"uptime": 82872, "capture": {"kernel_packets": 2541516, "kernel_drops": 0, "errors": 0}, "decoder": {"pkts": 254
Things Left Out, Things to Learn
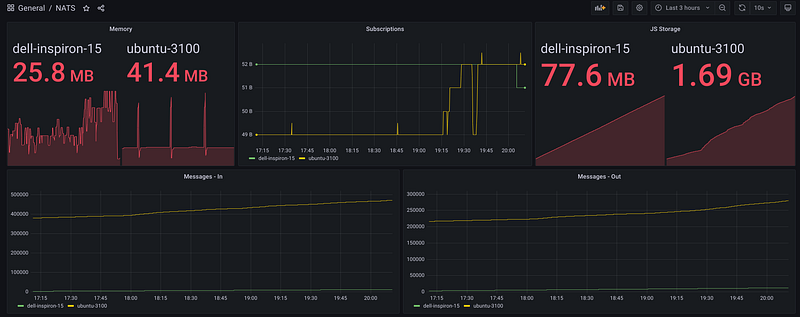
This blog already went way longer than I had anticipated, but there is a lot more that you can (and should) do with NATS: clustering, Authn/Authz, monitoring, backups, and more! I will close with a Grafana dashboard built by scraping the /varz endpoint with Telegraf, enjoy!
References
- https://nats.io/blog/jetstream-java-client-03-consume/
- https://gcoolinfo.medium.com/comparing-nats-nats-streaming-and-nats-jetstream-ec2d9f426dc8
- https://shijuvar.medium.com/building-distributed-event-streaming-systems-in-go-with-nats-jetstream-3938e6dc7a13
- https://gitlab.com/mdfranz/cheetsheetz/-/blob/master/nats.md