Saturday Morning with Filebeat-Redis-ELK
So I’m no stranger to log management. I worked Tenable and taught classes on LCE. I have run Ops teams that used Splunk or ran Threat…

So I’m no stranger to log management. I worked Tenable and taught classes on LCE. I have run Ops teams that used Splunk or ran Threat Detection/Hunt SaaS platforms built on ELSA or ElasticSearch and I’ve used some of the SaaS platforms in production. I’ve been around and have a few scars to prove it: outages, data loss, search queries gone wild, unparsed events crushing indexing, failed alerting. I’ve certainly seen it a bit of log management fail. Event collection, ingest, parsing, indexing, and search are not easy as easy as they might seem for folks that want to roll their own ELK stack, especially once you hit the scalability thresholds from trivial to non-trivial to how hard could it be?.
And that doesn't count plenty of hours fighting with syslog-ng or rsyslog as a sysadmin.
But i hadn’t played around with Filebeat yet, and was curious. I’d also never wired up ELK to Redis either and see how it worked, and if it worked.
The Setup
The first thing I did was created a few LXD containers on my old MacBook Pro which runs Ubuntu Server 16.04:
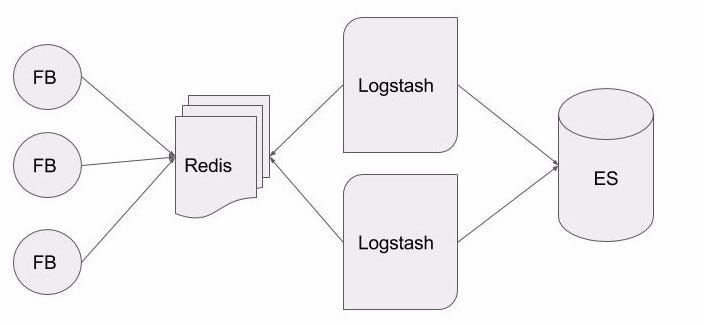
- Filebeat agents (v. 1.3.1) running on the host as well as inside the each of the containers all pointing at Redis server.
- A single Redis Server (v. 2.8.2) running in a container, installed from the default package repositories. No special configuration here.
- Multiple Logstash Indexers (v 2.4) that have Redis as their input and ElasticSearch as their output
- A single ElasticSearch (v2.4.1) node with OpenJDK 7.
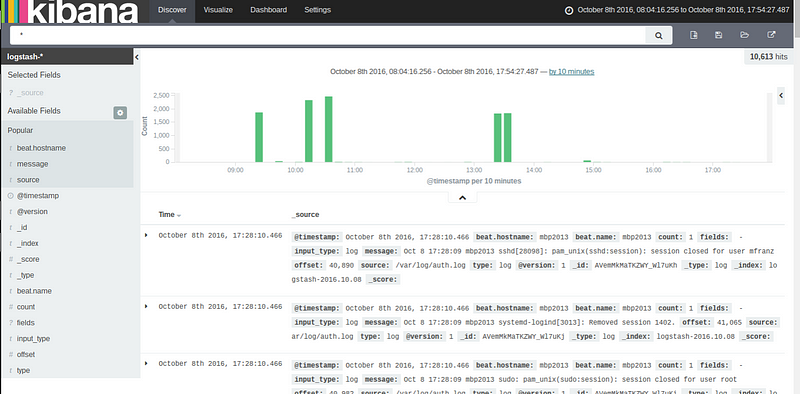
And of course Kibana to view the logs but, that is assumed here and I won’t bother. None of this was really necessary and all of this could have been put on a single node but I wanted to test a psuedo-distributed setup.
For the traffic dumps below this listing of container IP is helpful to follow what is going on. The host (running a filebeat as well) is obviously the .1 address of the lxdbr0 interface.root@mbp2013:~# lxc list | egrep '(redis|logstash)' │····························································
| another-logstash | RUNNING | 10.145.143.147 (eth0) | | PERSISTENT | 0 | │····························································
| logstash | RUNNING | 10.145.143.10 (eth0) | | PERSISTENT | 0 | │····························································
| redis | RUNNING | 10.145.143.181 (eth0) | | PERSISTENT | 0 |root@mbp2013:~# ifconfig lxdbr0 │····························································
lxdbr0 Link encap:Ethernet HWaddr fe:36:15:99:45:a4 │····························································
inet addr:10.145.143.1 Bcast:0.0.0.0 Mask:255.255.255.0
Filebeat
Filebeat is a “small” (4.1Mb) package that is written in Golang so you don’t have to install a JVM or use the existing JVM if you happen to run a Java stack if that scares you. It is a relatively new component that does what Syslog-ng, Rsyslog, or other lightweight forwarders in proprietary log forwarding stacks do. It monitors files and allows you to specific different outputs such as Elasticsearch, Logstash, Redis, or a file. I picked Redis because I’d never done this before. I’m oversimplifying this a lot, I won’t get into details on prospector configuration but it does the normal things you’d expect, filter lines, handle multi-line inputs typically found with Java applications.
I used the following /etc/default/filebeat/filebeat.yml configuration.filebeat:
prospectors:
- paths:
- /var/log/*.log
- input_type: log
registry_file: /var/lib/filebeat/registry
output:
redis:
host: "10.145.143.181"
port: 6379
save_topology: true
index: "filebeat"
db: 0
db_topology: 1
timeout: 5
reconnect_interval: 1
logging:
to_syslog: true
It took a bit of tweaking and as is the case with Logstash you get exceptions from the underlying language (not from the application) if you screw up the configuration, but through Googling I was able to figure it out and get it working. There is also little consistency in command-line options across their various tools, so you should definitely check the parametersWhen it runs it spawns 2 processes. I didn’t dig too deeply here. I assume filebeat-god is some sort of supervisor process.root 5909 0.0 0.0 9400 640 ? S 17:34 0:00 /usr/bin/filebeat-god -r / -n -p /var/run/filebeat.pid -- /usr/bin/filebeat -c /etc/filebeat/filebeat.yml
root 5910 0.0 0.1 654656 11708 ? Sl 17:34 0:07 /usr/bin/filebeat -c /etc/filebeat/filebeat.yml
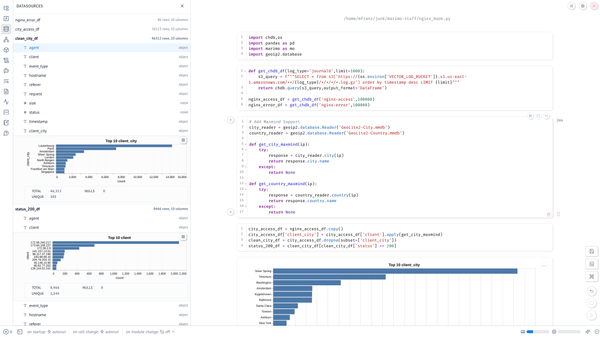
It puts its registry in /var/lib/filebeat/registry that tracks which files are monitored. If you blow this away and restart filebeat it will resend you logs upstream. That accounts for some of the green spikes it the title graphic.root@another-logstash:/var/lib/filebeat# cat registry | jq . | head -20
{
"/var/log/kern.log": {
"FileStateOS": {
"device": 2050,
"inode": 24787923
},
"offset": 5421,
"source": "/var/log/kern.log"
},
"/var/log/dpkg.log": {
"FileStateOS": {
"device": 2050,
"inode": 24787881
},
"offset": 55884,
"source": "/var/log/dpkg.log"
},
Filebeat is supposed to be intelligent and have some sort of backoff protection if the upstream (logstash or Elasticsearch) become congested but I didn’t test that.
Redis with Logstash
Elasticsearch (or any search engine, Sphinx or Splunk can certainly be a pain, too) can be an operational nightmare. Indexing can bog down. Searches can take down your cluster. Your data might have be reindexed for a whole variety of reasons. But I digress.
So the goal of putting Redis in between your event sources and your parsing and processing is to only index/parse as fast as your nodes and database can handle it so you can pull from the event stream instead of having events pushed into your pipeline. I’ve run large ElasticSearch clusters but not ELK clusters so I’m not exactly sure where things start falling down.
But let’s see what is going on if you run “redis-cli monitor.”
The RPUSH shows when an event was processed from /var/log/auth.log and then split into multiple log entries in JSON. This was generated when I logged into the console. A first level of parsing is done here.1475957773.500567 [0 10.145.143.1:51552] “RPUSH” “filebeat” “{\”@timestamp\”:\”2016–10–08T20:16:07.323Z\”,\”beat\”:{\”hostname\”:\”mbp2013\”,\”name\$│····························································
:\”mbp2013\”},\”count\”:1,\”fields\”:null,\”input_type\”:\”log\”,\”message\”:\”Oct 8 16:16:07 mbp2013 login[5790]: pam_unix(login:session): session │····························································
opened for user mfranz by LOGIN(uid=0)\”,\”offset\”:39272,\”source\”:\”/var/log/auth.log\”,\”type\”:\”log\”}” │····························································
1475957773.500818 [0 10.145.143.1:51552] “RPUSH” “filebeat” “{\”@timestamp\”:\”2016–10–08T20:16:07.323Z\”,\”beat\”:{\”hostname\”:\”mbp2013\”,\”name\$│····························································
:\”mbp2013\”},\”count\”:1,\”fields\”:null,\”input_type\”:\”log\”,\”message\”:\”Oct 8 16:16:07 mbp2013 systemd-logind[3013]: New session 1400 of use$│····························································
mfranz.\”,\”offset\”:39381,\”source\”:\”/var/log/auth.log\”,\”type\”:\”log\”}” │····························································
1475957773.500979 [0 10.145.143.1:51552] “RPUSH” “filebeat” “{\”@timestamp\”:\”2016–10–08T20:16:07.323Z\”,\”beat\”:{\”hostname\”:\”mbp2013\”,\”name\$│····························································
:\”mbp2013\”},\”count\”:1,\”fields\”:null,\”input_type\”:\”log\”,\”message\”:\”Oct 8 16:16:07 mbp2013 systemd-logind[3013]: Failed to start autovt@$│····························································
ty6.service: Unit autovt@tty6.service not found.\”,\”offset\”:39460,\”source\”:\”/var/log/auth.log\”,\”type\”:\”log\”}” │····························································
1475957773.666858 [0 10.145.143.10:44616] “evalsha” “3236c446d3b876265fe40ac665cb6dc17e6242b0” “1” “filebeat” “124” │····························································
1475957773.667005 [0 lua] “lrange” “filebeat” “0” “124” │····························································
1475957773.667100 [0 lua] “ltrim” “filebeat” “125” “-1” │····························································
1475957773.667452 [0 10.145.143.147:34976] “evalsha” “3236c446d3b876265fe40ac665cb6dc17e6242b0” “1” “filebeat” “124” │····························································
1475957773.667556 [0 lua] “lrange” “filebeat” “0” “124” │····························································
1475957773.667593 [0 lua] “ltrim” “filebeat” “125” “-1” │····························································
1475957773.670089 [0 10.145.143.10:44616] “evalsha” “3236c446d3b876265fe40ac665cb6dc17e6242b0” “1” “filebeat” “124”"
We see logtash looking for 125 entries in the list with the LRANGE command. Most of the time this will return and empty list.127.0.0.1:6379> lrange "filebeat" 0 124
(empty list or set)
127.0.0.1:6379>
If you were to run tcpdump on the redis node you would see something like this. The 94 byte messages are the “evalsha” operations listed above which runs a LUA script inside the Redis Input which I assume checks for new messages.
The redis server is .181 and the two logstash hosts are .147 and .10 so if you look at the trace below you’ll see a 966 byte message go from filebeat to redis, then an 883 byte message to the logstash host which in turn would be indexed in Elasticsearch, which wouldn’t show up here because I was sniffing from inside the container. (Or I assume that is what happening here, didn’t run ngrep on this exact trace)10.145.143.147.34976 > 10.145.143.181.6379: tcp 94 10.145.143.10.44616 > 10.145.143.181.6379: tcp 94 10.145.143.181.6379 > 10.145.143.147.34976: tcp 4 10.145.143.147.34976 > 10.145.143.181.6379: tcp 0 10.145.143.181.6379 > 10.145.143.10.44616: tcp 4 10.145.143.10.44616 > 10.145.143.181.6379: tcp 0 10.145.143.1.51552 > 10.145.143.181.6379: tcp 966 10.145.143.181.6379 > 10.145.143.1.51552: tcp 12 10.145.143.1.51552 > 10.145.143.181.6379: tcp 0
10.145.143.147.34976 > 10.145.143.181.6379: tcp 94
10.145.143.10.44616 > 10.145.143.181.6379: tcp 94
10.145.143.181.6379 > 10.145.143.147.34976: tcp 883 10.145.143.147.34976 > 10.145.143.181.6379: tcp 0 IP 10.145.143.181.6379 > 10.145.143.10.44616: tcp 4 10.145.143.10.44616 > 10.145.143.181.6379: tcp 0
Logstash: last but not least
I’ve been fooling around with logstash for years, so the only piece I’ll add here is how the Redis input is configured on the container that runs ES.root@logstash:/etc/logstash/conf.d# cat filebeattoes.conf
input {
redis {
host => "10.145.143.181"
data_type => "list"
key => "filebeat"
}
}
output {
elasticsearch { }
}
My other logstash node is pretty close except I had to specify the ES server running on a different container instead of the default which is localhost.root@another-logstash:/etc/logstash/conf.d# cat another.conf
input {
redis {
host => "10.145.143.181"
data_type => "list"
key => "filebeat"
}
}
output {
elasticsearch { hosts => ["10.145.143.10:9200"] }
}
Recently they’ve changed the syntax from host to hosts, so it is something I always forget lately.