Exploring AWS CloudWatch Logs with jq and jid
AWS CloudWatch has been around forever and CloudWatch Logs has been available for the last few years, but I’ve really only started using…

AWS CloudWatch has been around forever and CloudWatch Logs has been available for the last few years, but I’ve really only started using the latter in the last few months.
Forget reading the online documentation. I never do that first. Yeah you can start poking around in the AWS Console, but I’ve always found the best way to learn a new AWS service is through trial and error with the AWS CLI. Try different arguments see what works. RTFM.
Since the default CLI output is JSON, the JSON Interactive Digger and jq are two useful tools for parsing and viewing the output of the CLI. To illustrate some of the basic elements of CloudWatch Logs, here are some real world examples of Linux logs I forwarded using the Linux agent.
Log Streams and Log Groups
The primary unit of CloudWatch logs is the log group. It is where you define retention policy and can define metric or subscriptions filters. You can perform searches against a log group either through the UI or the CLI.
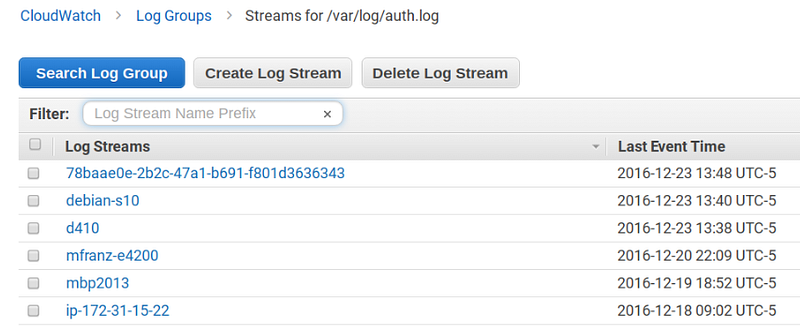
Log groups consist of multiple log streams, which most typically correspond to individual hosts or instances of the agent, but don’t necessarily have to. These are defined in your agent configuration in a file like this[/var/log/syslog]
datetime_format = %b %d %H:%M:%S
file = /var/log/syslog
buffer_duration = 5000
log_stream_name = {hostname}
initial_position = start_of_file
log_group_name = /var/log/syslog
[/var/log/auth.log]
datetime_format = %b %d %H:%M:%S
file = /var/log/auth.log
buffer_duration = 5000
log_stream_name = {hostname}
initial_position = start_of_file
log_group_name = /var/log/auth.log
[/var/log/daemon.log]
datetime_format = %b %d %H:%M:%S
file = /var/log/daemon.log
buffer_duration = 5000
log_stream_name = {hostname}
initial_position = start_of_file
log_group_name = /var/log/daemon.log
Assuming you’ve properly configured your CLI, you can browse the output of log groups (sort of like more/less) with the jid. The “-q” option allows you to get the filter expression that you can later put into jq.mfranz@d410:~/aws$ aws --region us-east-1 logs describe-log-groups | jid -q
[Filter]> .logGroups[2]
{
"arn": "arn:aws:logs:us-east-1:ACCOUNT:log-group:/var/log/auth.log:*",
"creationTime": 1478435494330,
"logGroupName": "/var/log/auth.log",
"metricFilterCount": 2,
"retentionInDays": 30,
"storedBytes": 9581998
}
.logGroups[2]mfranz@d410:~/aws$
From above you can tell that CloudWatch logs (like most AWS services) is tied to a specific region and account.
If we pipe the output to jq we can get a list of the log group names. Notice that the [] will return a list and no longer has an index like above.mfranz@d410:~/aws$ aws — region us-east-1 logs describe-log-groups | jq .logGroups[].logGroupName
“/aws/lambda/mfranzLoginLogger”
“/var/log/audit/audit.log”
“/var/log/auth.log”
“/var/log/daemon.log”
“/var/log/squid3/access.log”
“/var/log/syslog”
“nxlog”
“suricata”
“suricata-json”
You can see I have some Lambda logs as well as some logs from Squid, Suricata, an NXLOG aggregator (where I’m pulling in logs from systems that can’t run the AWS agent such as Windows and one of my home routers).
What you will notice is that actually it would appear that the stream name can belong to multiple log groups. 78baae0e-2b2c-47a1-b691-f801d3636343 is a Debian KVM instance running on SmartOS that is forwarding “daemon.log” (where I’ve enabled BIND query logging) as well as is pulling in nxlog, but if you look more closely you will see two unique ARNs.
arn:aws:logs:us-east-1:ACCOUNT:log-group:nxlog:log-stream:78baae0e-2b2c-47a1-b691-f801d3636343
arn:aws:logs:us-east-1:ACCOUNT:log-group:/var/log/daemon.log:log-stream:78baae0e-2b2c-47a1-b691-f801d3636343"$ aws --region us-east-1 logs describe-log-streams --log-group-name nxlog
{
"logStreams": [
{
"firstEventTimestamp": 1478995200000,
"lastEventTimestamp": 1482516060000,
"creationTime": 1479573905058,
"uploadSequenceToken": "49567791901379358839044625368633188281675451016484534978",
"logStreamName": "78baae0e-2b2c-47a1-b691-f801d3636343",
"lastIngestionTime": 1482519901916,
"arn": "arn:aws:logs:us-east-1:ACCOUNT:log-group:nxlog:log-stream:78baae0e-2b2c-47a1-b691-f801d3636343",
"storedBytes": 9429322
}
]
}$ aws --region us-east-1 logs describe-log-streams --log-group-name "/var/log/daemon.log"
{
"logStreams": [
{
"firstEventTimestamp": 1482412286000,
"lastEventTimestamp": 1482519971000,
"creationTime": 1482412300632,
"uploadSequenceToken": "49567768457787871119317303010906990431796143268510603474",
"logStreamName": "78baae0e-2b2c-47a1-b691-f801d3636343",
"lastIngestionTime": 1482520396709,
"arn": "arn:aws:logs:us-east-1:ACCOUNT:log-group:/var/log/daemon.log:log-stream:78baae0e-2b2c-47a1-b691-f801d3636343",
"storedBytes": 0
}
}
Streams primarily have elements related to event ingestion, such as the first and last event timestamp and time.
Searching Logs using the CLI
Searching through the AWS Console is pretty straightforward although not as powerful as something like Papertrail or other SaaS offerings.
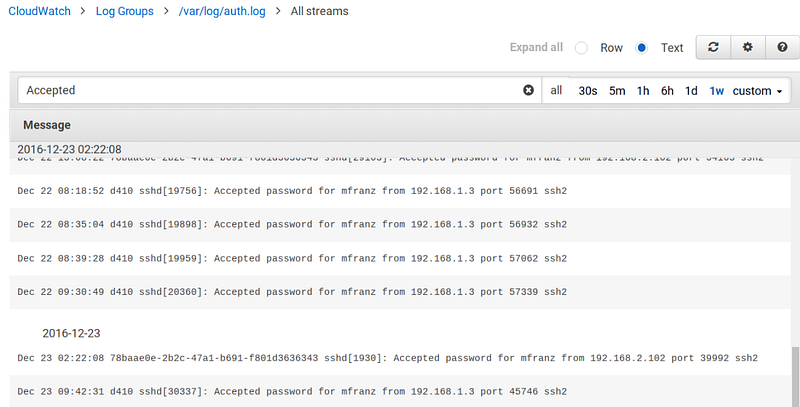
But lets see how we can do the same from the CLI. And if you can do it from the CLI then you can do it from boto3 which would allow you to execute from Lambda functions
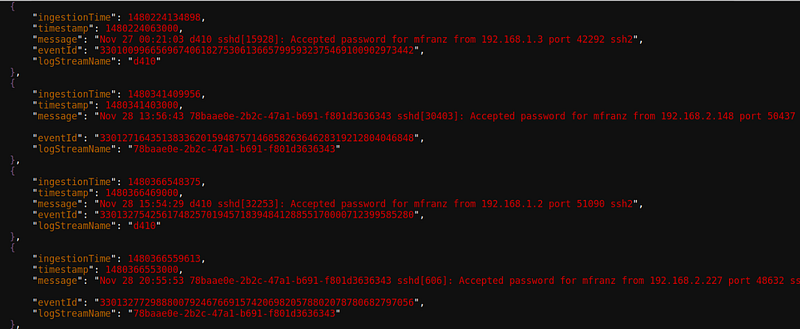
Let’s perform the same search from the CLI.mfranz@d410:~/aws$ aws --region us-east-1 logs filter-log-events --log-group-name "/var/log/auth.log" --filter-pattern Accepted --max-items 1
{
"searchedLogStreams": [
{
"searchedCompletely": true,
"logStreamName": "78baae0e-2b2c-47a1-b691-f801d3636343"
},
{
"searchedCompletely": true,
"logStreamName": "d410"
},
{
"searchedCompletely": true,
"logStreamName": "debian-s10"
},
{
"searchedCompletely": true,
"logStreamName": "ip-172-31-15-22"
},
{
"searchedCompletely": false,
"logStreamName": "mbp2013"
}
],
"NextToken": "eyJuZXh0VG9rZW4iOiBudWxsLCAiYm90b190cnVuY2F0ZV9hbW91bnQiOiAxfQ==",
"events": [
{
"ingestionTime": 1480032990411,
"timestamp": 1480032985000,
"message": "Nov 25 00:16:25 78baae0e-2b2c-47a1-b691-f801d3636343 sshd[29473]: Accepted password for mfranz from 192.168.2.102 port 37918 ssh2",
"eventId": "33005838483905695783866436695176143863386705298572836864",
"logStreamName": "78baae0e-2b2c-47a1-b691-f801d3636343"
}
]
}
The keys option will allow you to dump the keys, which will return three values. Events is where most of what we care about is.$ aws --region us-east-1 logs filter-log-events --log-group-name "/var/log/auth.log" --filter-pattern Accepted --interleaved --max-items 1 | jq "keys"
[
"NextToken",
"events",
"searchedLogStreams"
]
And if you pipe together you can see the keys for each event.$ aws --region us-east-1 logs filter-log-events --log-group-name "/var/log/auth.log" --filter-pattern Accepted --interleaved --max-items 1 | jq ".events[0]" | jq 'keys'
[
"eventId",
"ingestionTime",
"logStreamName",
"message",
"timestamp"
]
And you could then get just the 10 most recent messages by just extracting that element.$ aws --region us-east-1 logs filter-log-events --log-group-name "/var/log/auth.log" --filter-pattern Accepted --interleaved --max-items 100 | jq ".events[]" | jq .message | tail
"Dec 21 20:45:25 78baae0e-2b2c-47a1-b691-f801d3636343 sshd[22654]: Accepted password for mfranz from 192.168.2.102 port 51568 ssh2"
"Dec 22 07:37:15 d410 sshd[19440]: Accepted password for mfranz from 192.168.1.3 port 55568 ssh2"
"Dec 22 13:08:22 78baae0e-2b2c-47a1-b691-f801d3636343 sshd[29103]: Accepted password for mfranz from 192.168.2.102 port 54163 ssh2"
"Dec 22 08:18:52 d410 sshd[19756]: Accepted password for mfranz from 192.168.1.3 port 56691 ssh2"
"Dec 22 08:35:04 d410 sshd[19898]: Accepted password for mfranz from 192.168.1.3 port 56932 ssh2"
"Dec 22 08:39:28 d410 sshd[19959]: Accepted password for mfranz from 192.168.1.3 port 57062 ssh2"
"Dec 22 09:30:49 d410 sshd[20360]: Accepted password for mfranz from 192.168.1.3 port 57339 ssh2"
"Dec 23 02:22:08 78baae0e-2b2c-47a1-b691-f801d3636343 sshd[1930]: Accepted password for mfranz from 192.168.2.102 port 39992 ssh2"
"Dec 23 09:42:31 d410 sshd[30337]: Accepted password for mfranz from 192.168.1.3 port 45746 ssh2"
"Dec 23 14:45:23 d410 sshd[425]: Accepted password for mfranz from 192.168.1.3 port 56902 ssh2"
Using tail is sort of a hack to sort by time so you should the “start-time” and “end-time” arguments to specify how far back you want to search and where you want to stop searching. NOTE: This is in milliseconds so this is a large number.
By going to Epoch Time Converter you can find out how far you want to search back. For example this would be to stop at December 15th. You can see for yourself the last timestamp is less than than what is specified at “end-time”mfranz@d410:~/aws$ aws --region us-east-1 logs filter-log-events --log-group-name "/var/log/auth.log" --filter-pattern Accepted --end-time 1481832891000 | jq '.events[]' | jq .timestamp | tail
1481400048000
1481400201000
1481401677000
1481401942000
1481414401000
1481418073000
1481475576000
1481503698000
1481555245000
1481731619000
Note I’ve been using “filter-log-events” because it allows me to filter on an entire group, but you could use “get-log-events” if you want to perform searches across just a single stream. Both have similar syntax.